Abstract
Excess levels of plant nutrients are being applied to soils when effluent from waste treatment lagoons is repeatedly irrigated on small parcels of land adjacent to large poultry operations. Therefore, field research was conducted at College Station and Overton, TX, to evaluate the effects of poultry lagoon effluent on soil, vegetation and surface runoff quality.

Loading Turf Tiger® spreading unit with topdress quality dairy manure compost.
Two cropping systems, bermudagrass and a bermudagrass/ryegrass rotation, and three application rates, 0, 538 and 1076 kg N/ha/yr, were studied in experimental plots 1.2 m wide and 2.4 m long, from February 1995 to April 1996. Each treatment was replicated three times in a modified random block design. The site located near College Station was on a Burco series clayey soil with a 0.5% slope. The site near Overton site was on a Bowie series fine-loamy soil with a 5.0% slope. Nutrient increases in the soil were directly related to effluent nutrient levels and background soil concentrations. Nitrate and potassium concentrations significantly increased throughout the soil profile to a depth of 914 mm at the 1076 kg N/ha/yr rate at Overton. The 1076 kg N/ha/yr rate did not significantly increase yields on either crop system above the yields at the 538 kg N/ha/yr rate. The bermudagrass/ryegrass crop was the most effective in nutrient uptake with 51% N, 43% P and 35% K taken up by the vegetation at the 538 kg N/ha/yr rate. Nutrient losses in the surface runoff were directly related to slope. Nitrogen losses in the surface runoff at the Overton site were three to five time higher than at the College Station site. However, average nutrient concentrations in the surface runoff at the two sites were similar with large standard deviations.
Keywords
Poultry lagoon effluent, land application, soil quality, bermudagrass, ryegrass, surface runoff quality, vegetation quality.
INTRODUCTION
Many large-scale caged-layer poultry operations use flush systems for waste removal into lagoons for manure and wastewater treatment. The manure and wastewater are anaerobically treated in a primary lagoon and in some cases a secondary lagoon. Large volumes of liquid effluent are produced. Primary and/or secondary treated effluent is generally recirculated for use as flush water for manure removal and stored effluent is land applied for further treatment and ultimate disposal.
Disposal of poultry lagoon effluent is an environmental concern for large poultry farm operators and the general public. Repeated applications of lagoon effluent can cause high levels of nitrogen (N), phosphorus (P), potassium (K) and other elements in the soil and vegetation. Land application of lagoon effluent, if improperly managed, can contribute to the degradation of surface water and ground water (Linsley et al., 1992).
Poultry lagoon effluent has high concentrations of N, P, K, calcium (Ca), and magnesium (Mg) that can benefit vegetation (Raabe et al., 1984). The micro-nutrients iron (Fe), manganese (Mn), zinc (Zn), and copper (Cu) are also present in lagoon effluent. Field et al. (1986) showed that anaerobically treated poultry manure effluent produces approximately the same corn grain yield as urea and poultry manure influent (not anaerobically digested) amendments when applied at the same N rate. At one site, grain yield nearly doubled compared to sites without any form of fertilizer.
However, nutrient concentrations in effluent can vary widely among lagoons and are dependent upon meteorological conditions. Concentrations vary with the feed stuff, weather, lagoon size, loading rates, disposal rates, and other factors. A typical range of nutrient concentrations found in effluent at six Texas poultry lagoons at three poultry farms during the summer of 1994 is shown in table 1.
Often, effluent is applied on the land at rates that provide nutrients in excess of vegetation needs. Concerns with excess loading rates can increase when there is insufficient rain, irrigation soil water to ensure growth of crops. Excessive concentrations of NO3 and soluble salts in the soil can lead to nutrient leaching into the ground water and contamination of drinking water (Linsley et al., 1992). In addition, the transport of nutrients in surface water runoff may create algal blooms which, when they decompose, lower the dissolved oxygen levels in nearby rivers and lakes (Davis, 1991). Excessive nutrients in the soil can also reduce crop yields (Brown, 1995) and produce unacceptably high nutrient concentrations in vegetation that can cause health problems for grazing animals (NSF, 1996). The dispersion of soil clay with the resultant sealing of the soil to water and air is another problem associated with high nutrient concentrations, particularly salts of Na, in the soil (Brown, 1995).
Historically, nitrate-N (NO3-N) is usually the element of concern when considering the nutrients leaching into the groundwater. High NO3 concentrations in drinking water can cause methemoglobinemia in infants. This prompted the U.S. Environmental Protection Agency (EPA) to set a maximum contaminant level (MCL) of 10 mg/L NO3-N in drinking water (Brown, 1995). In effluent, nutrients other than NO3, chloride, and sulfate have a stronger tendency to stay adsorbed in the soil (Brown, 1995).
In surface water, the presence of small quantities of N and P can lead to algal blooms which deplete dissolved oxygen levels. Dissolved orthophosphate concentrations are usually greater than 5 to 20:g/L in surface water and seldom exceed 100:g/L even in highly eutrophic waters (Boyd, 1996). However, as little as 5:g of inorganic P per liter is needed for eutrophication under summer conditions (Sawyer et al., 1994). Phosphorus levels have been found in excess of 1,000 mg/kg in soils that have received repeated effluent applications over many years and have the potential to contaminate surface water (Sweeten, 1995).
Sodium, a significant portion of salts, can also accumulate in soil. Total salt content is approximated by measuring electrical conductivity (EC). Yield of some crops can be affected with EC values of 400 mS/m (millisiemen per meter), while bermudagrass is tolerant up to 1,600 mS/m (Brown, 1995).
Copper concentrations in the soil can be increased by application of lagoon effluent. This may result in increased concentrations of Cu in the vegetation that can then be passed on to grazing animals. Studies indicate that up to 68 kg Cu/ha did not cause significant increases in Cu concentrations in bermudagrass and fescue (Wilkinson and Stuedemann, 1990).
Nutrient imbalances from excessive K can cause grass tetany by negatively affecting Mg uptake (Robinson and Eilers, 1996). High levels of N, P, and K in forage can also have negative health effects on cattle as shown in table 2.
To prevent degradation of soil and water quality, states have set rates for the quantity of lagoon effluent that can be land applied. In most states, N is the controlling nutrient for determining application rates of effluent. The Texas Agricultural Extension Service generally recommends an application rate of up to 269 kg of plant available N/ha/year for most forages or crops (Sweeten, 1986). However, after repeated applications of lagoon effluent at this rate, concentrations of other nutrients (P, K, Mg) may increase dramatically (Brown, 1995). Studies show that vegetation cannot take up all of the applied nutrients (Brown, 1995), and excess P often occurs at land application sites. Therefore, it may not always be appropriate to use the N content of lagoon effluent as the rate determining factor for land application. In Texas, a proposal has been made to limit the application of animal waste to land when the P level in the soil exceeds 200-250 mg/kg extractable P (Recommendations, 1992), and the level of 200 mg/kg has been included as a best management practice in subsequent state regulations for new operations (TNRCC, 1995).
Vegetative Filter Strips (VFS) have been studied to reduce nutrient runoff from fields receiving agricultural wastes. On the down-slope side of a land application field, a strip of dense vegetation 21 m in width, greatly reduced the amount of total P in the surface runoff, but had little effect on lowering NO3 concentration (Chaubey et al., 1995 and McFarland et al., 1995). The 21 m VFS reduced total P in the runoff from 1.90 mg/L to 0.4 mg/L (McFarland et al., 1995) and from 7.62 mg/L to 0.22 mg/L (Chaubey et al., 1995). It should be noted that the resulting runoff concentrations were still an order of magnitude, or more, than levels that can cause in-stream eutrophication. The objectives of this research were to determine the effects of various application rates of poultry lagoon effluent on soil, vegetation and surface runoff quality.
EXPERIMENTAL DESIGN
Poultry lagoon effluent was applied to plots of annual ryegrass (Lolium multiflorum Lam.) and Coastal bermudagrass (Cynodon dactylon L. Pers ). Total annual effluent rates applied were 0, 538 (1X) and 1076 (2X) kg N/ha/yr. Forage crop systems were bermudagrass only and a bermudagrass – ryegrass rotation. Treatments were replicated three times and assigned to the experimental plots in a modified random block design.
Soil, vegetation and surface runoff water samples were collected from each experimental plot throughout the study to assess the effects of the effluent application rates on the environment. These samples were analyzed for N, P and K. Soil samples were also analyzed for pH, EC, and NO3-N. Vegetation yields were determined for each plot.
FIELD METHODS
Experimental Plots
The research was conducted on Texas Agricultural Experiment Station farms near College Station and Overton. Experimental plots were 1.22 m wide and 2.44 m long. The plots were delineated using 203 mm wide metal or plastic edging inserted 50 mm into the ground along three sides. On the fourth side, a surface runoff collection box (1.22 m long x 0.61 m wide x 0.31 m deep) was cemented into the soil flush with the surface on the down slope side of each plot. The sheet metal collection boxes had removable lids and a small sump (90 x 90 x 100 mm) to allow the surface runoff to be sampled and quantified.
Each row of six plots represented a replication of the treatments (3 application rates x 2 cropping systems). Plots were separated by 1.22 m on the sides and 2.44 m at the ends. The sites sloped approximately 0.5% at College Station and 5.0% at Overton.
The soil at the College Station site in Burleson County was a Burco series (clayey mixed, thermic Fluventic Ustochrepts). This series is typically well drained, very slowly permeable and is located on floodplains. These soils are calcareous, and have a high available water capacity.
The soil at the Overton site in Rusk County was a Bowie series (fine-loamy, siliceous, thermic Plinthic Paleudults). The Bowie series is typically well drained, moderately permeable, has low to moderate available water capacity, and is moderately to strongly acidic.
Vegetation
The experimental plots were installed in fields containing established bermudagrass. Ryegrass was seeded over the bermudagrass in October of 1994 and 1995 at an application rate of 35 kg/ha. No cultivation or additional fertilization was performed prior to the ryegrass seeding. Two representative sections of vegetation (0.10 m2 at College Station and 0.09 m2 at Overton) were collected from each plot at each harvest (table 3). Vegetation samples were dried at 60oC or higher for at least 48 hours and weighed to determine yield. A sub-sample of the dried vegetation was reserved for nutrient analysis. Excess vegetation was removed from the plots after yield samples were obtained.
Soil Sampling
At the College Station site, five soil sample collections were conducted at approximately three month intervals (table 4). Samples were taken to a depth of 610 mm in 152 mm increments using a 25 mm diameter (ID) soil probe. At the Overton site, soil samples were obtained prior to the first effluent application and at the end of the experiment. Depths sampled were of 0 – 150 mm, 150 – 310 mm, 310 – 610 mm and 610 – 910 mm, using a 19 mm diameter (ID) soil probe. All soil samples were a composite of four sub-samples. Soil samples were dried at 60oC, or higher, for at least 48 hours and ground finer than 0.85 mm. The sample holes in the experimental plots were back-filled with kaolinite clay at College Station and with a mixture of sand and bentonite at Overton.
Surface Runoff
The runoff water collection containers were checked after each rainfall event. When a significant rainfall event occurred, the volume of water in each runoff container was determined. Samples were obtained for laboratory analysis from each plot that had runoff. After the runoff was quantified and sampled, the collection boxes were emptied and cleaned. All runoff samples were frozen until analyses were performed. The total volume of surface runoff was determined for each plot and was also tested for pH, EC, and NO3-N. Meteorological conditions were recorded at each site.
Effluent Application
Effluent was applied at 77 and 154 kg N/ha (1X and 2X rates) for each growth of ryegrass/bermudagrass. The bermudagrass, where no ryegrass had been inter-seeded, received applications of 135 and 269 kg N/ha for each of four cuttings. Equal volumes of water were applied to each plot during each application time. The volume of clean water applied to the check plots was determined by the volume of the effluent applied to the 2X plots. Clean water was also added to the 1X plots to make the total volume of water applied to the 1X and 2X plots equivalent. The volume of effluent required for the 1X and 2X plots was determined by analysis for N in the effluent immediately prior to each application.
Lagoon effluent was obtained from poultry operations in the vicinity of each research site. Effluent was pumped directly from primary treatment lagoons and trucked to the research sites for application. Samples of effluent were obtained and frozen for complete nutrient analysis at a later date. The dates of effluent application at the College Station and Overton sites are shown in table 5.
The effluent and clean water were evenly applied to the plots using 4.7 L sprinkler cans. Clean water was obtained from a municipal water supply at College Station and from a farm pond at Overton. The total volume of liquid applied to each plot for each application ranged from 75 to 95 L (25 to 32 mm) at College Station and 28 to 38 L (9 to 13 mm) at Overton, depending on the concentration of total N in the effluent.
LABORATORY METHODS
Effluent and Surface Runoff
Effluent and runoff water samples were analyzed for pH using a glass-calomel combination electrode connected to an Accument 145 pH/mV/ISE meter. Conductivity was measured with a conductivity probe connected to a YSI Model 34 scientific meter.
For total N analysis, the effluent and water samples were digested using a sulfuric acid solution containing copper sulfate, lithium sulfate, and selenium catalysts (Nelson and Sommers, 1980). Total N was determined using an Orion 12 ammonia ion selective electrode (ISE) (Eastin, 1976). The ammonia electrode was sensitive to ammonia concentrations in the analyzed sample from 0.014 mg/L to 14,000 mg/L. With sample dilution, approximate accuracy was ±5 mg/L. Water runoff samples were analyzed for total N by a Scientific Instruments Model BD-20/BD-40 (Dialyzer) auto-analyzer. The auto-analyzer was operated at a sensitivity range of 1 to 50 mg/L.
Potassium, Ca, Mg, and Na were analyzed in digests of water samples with a Perkin- Elmer atomic absorption spectrophotometer (AAS). The AAS sensitivity was approximately 2% for K with a sensitivity range of 0.04 to 12.0 mg/L.
Total P was measured on digests of water samples with a vanadomolybdic acid colorimetric procedure (Jackson, 1958). Samples were compared to standards with a color development curve created with a spectrophotometer at a wavelength of 440 nm with a precision of approximately 0.1 mg/L in a range from 1.0 to 50.0 mg/L.
Vegetation
Dried plant samples were ground to pass a 0.85 mm screen for chemical analysis. These samples were digested and analyzed for N, K, and P using the same procedures that were used for water samples.
Soil
Soil samples were dried and ground to pass a 2.0 mm screen prior to chemical analysis. For pH, 40 mL of water were added to 20 g of dry soil (2:1 w/w basis) and briefly stirred. After the samples equilibrated for 30 minutes, they were re-stirred and the pH was determined with a pH glass electrode connected to a Accument 145 pH/mV/ISE meter. Conductivity was measured using a YSI Model 34 scientific meter after the samples were allowed to settle for an hour. Phosphorus and K were extracted with a solution containing 0.025M EDTA and 1.4M ammonium acetate adjusted to pH 4.2 with HCl. The soil:solution ratio was 1:20 w/v (1.5 g:30 mL) (Hons et al., 1990). Samples were shaken for one hour at 250 cycles per minute and filtered through Whatman #40 filter paper. Potassium concentrations in soil extracts were determined by atomic absorption spectrophotometry. Extracted P was measured in the soil extracts by the stannous chloride reduction of molybdate on a spectrophotometer at 670 nm (Jackson, 1958). Soil nitrate was extracted with a saturated solution of Ca(OH)2 and analyzed colorimetrically by the chromotropic acid method (Haby, 1989). Nitrate concentration was measured on a spectrophotometer at 410 nm.
STATISTICAL METHODS
All data for vegetation, soil, and surface water runoff were the result of the mean of three samples (replicated plots). An analysis of variance (ANOVA) and a Student-Newman-Keuls (SNK) test at an alpha value of 0.1 were used to statistically evaluate the data. The SNK test was used to evaluate if the means were statistically different between the three effluent application rates and the two vegetation systems. The data were compared only within each event such as vegetation harvest or soil sampling. Vegetation data were not statistically compared from one harvest to the next.
RESULTS AND DISCUSSION
Nutrient Analysis of Effluents
Effluent obtained from FeatherCrest Farms (College Station) and Pilgrim’s Pride (Overton) was sampled and analyzed for nutrient content before each application. The concentrations of most nutrients except Mg in the lagoon effluent obtained from Pilgrim’s Pride were higher than in that from FeatherCrest Farms (table 6). The ratio of N to P for the lagoon effluent used in this study (8.6:1) was much larger when compared to typical cattle manure, 2.5:1, (Brown, 1995) and poultry litter, 4.1:1, (Edwards, 1993).
Effluent Effects on Soils
The application of lagoon effluent had no effect on soil pH at the College Station site. The soil pH at the College Station site was approximately 7.8 before and after the applications. The average pH of the effluent applied at the College Station site was 7.85. At the Overton site,
plots which received the 2X application of lagoon effluent had an increase in pH in the 0-152 mm depth soil samples. The average pH of the effluent applied at the Overton site was 8.1. This raised the pH from approximately 6.0 to 6.5 on the 2X bermudagrass plots and from 5.8 to 6.8 on the plots with bermudagrass/ryegrass. The effluent applications did not have a significant effect on the soil pH below a depth of 152 mm at Overton.
At the College Station site, the application of lagoon effluent had no significant effect on the E.C. of the soil at any depth. This was due to the relatively high background soil E.C. that averaged 64.3 mS/m for all depths. Large quantities of effluent with an average E.C. of 843 mS/m (FeatherCrest effluent, table 6) would have to be applied before differences could be statistically verified. Soil E.C. at the Overton site was significantly increased by the 2X rate of application to a depth of 152 – 305 mm. However, no significant E.C. changes were detected below 305 mm. The data suggests that the 2X application of effluent would increase the soil conductivity by approximately 10 mS/m per year to a depth of 305 mm. Soil E.C. in plots treated with the 1X rate remained nearly the same during the study at all depths. The plots which received only water (0X) generally showed a decrease in conductivity.
At both sites, there was a significant increase in NO3-N concentrations in the soil. At the College Station site the 2X rate produced significantly higher NO3-N concentrations then the 0X and 1X application rates in each soil depth on the bermudagrass/ryegrass plots (table 7). On the bermudagrass 2X plots, NO3-N concentrations were higher through the first 305 mm, but this increase was not statistically significant. Effluent was applied to the bermudagrass/ryegrass plots two months before the soil samples were taken on March 22, 1996. The significant increase in the 2X bermudagrass/ryegrass plot at the 457 – 610 mm depth indicates that nitrates moved rapidly through the clay soil at the College Station site. On both crop systems at Overton, the 2X effluent application significantly increased NO3-N concentrations over the 0X rate at all soil depths except 305 – 610 mm (table 8). In the first 152 mm of soil, the 2X rate of effluent application raised the average NO3-N concentrations in the soil to about 10 mg/kg compared to 3 mg/kg in the soil from the plots which received only water. Data in table 8 also indicate that the 2X effluent application rate resulted in NO3-N moving through the soil profile to a depth of at least 610 – 914 mm.
Phosphorus concentrations in both soils were not affected by effluent application. The amount of P applied in lagoon effluent was relatively low, 142 kg/ha/yr on 2X plots at College Station and 113 kg/ha/yr on 2X plots at Overton. With only one year of effluent application, insufficient P had been applied for significant changes to occur at any depth. Background P concentrations at the Overton site ranged from 24 mg/kg (0 – 152 mm) to 0 mg/kg (610 – 914 mm). At the College Station site, P concentrations were much higher, ranging from 146 mg/kg (0 – 152 mm) to 39 mg/kg (457 – 610 mm). In the first year, fixation and uptake by vegetation apparently used most of the plant available P applied with the effluent as no significant increases in P were detected at any depth at either site.
At College Station all plots that received 1X and 2X effluent applications had significantly higher K concentrations in the first layer of soil (0-152 mm) than the plots that received only water. The K concentrations averaged 461 mg/kg in the 0X plots, 572 mg/kg in the 1X plots and 625 mg/kg in the 2X plots, for both vegetative systems. At the Overton site, K concentrations in the 2X effluent application plots with the bermudagrass/ryegrass treatment were significantly higher than the 0X application plots through each soil depth sampled (table 9).
Effluent Effects on Vegetation
The most pronounced effect of lagoon effluent application was on vegetation yield. The vegetation was a darker green and the stand was more dense on the plots that received effluent. In addition, the plots that received the 2X effluent application were a darker green and more dense than in plots that received a 1X application. At the College Station site, the total dry matter yield for both vegetative systems at the 0X effluent rate was approximately 6,000 kg/ha (table 10). The 1X effluent plots had a total yield of approximately 14,500 kg/ha with both vegetative systems. The bermudagrass vegetative system which received a 2X effluent application had a total yield of 16,500 kg/ha while the bermudagrass/ryegrass system had a yield of 18,300 kg/ha. At College Station, total yield was not significantly different between the two vegetative systems at the same application rate.
At the Overton site, the two-crop system had a much higher total yield than the one crop system (table 11). On the bermudagrass system, the yield increased from 10,700 kg/ha to 18,000 kg/ha from the 0X to 2X effluent application, respectively. On the bermudagrass/ryegrass system the yield increased from 17,300 kg/ha to 25,000 kg/ha. The vegetation data from the Overton site demonstrates the benefits of a two-crop system for obtaining additional yield and producing suitable forage over a longer time period. The differences were less apparent at the College Station site due to a late start in effluent applications in the spring of 1995.
Typically, the additional N applied with the 2X effluent application rate did not significantly increase crop yields when compared to the other application rates. For both vegetation systems at both sites, the total yield increased from the 1X to the 2X effluent rate, but only in the bermudagrass/ryegrass system at the College Station site was the increase statistically significant. Therefore, it can be concluded that application of N from poultry lagoon effluent at rates higher than 538 kg/ha/yr will provide more than adequate N for maximum forage yield.
Even though the yield did not increase with additional N above the 1X rate, the N uptake by the vegetation increased significantly with the additional application of effluent. This occurred primarily due to the higher concentrations of N in the vegetation which received the 2X effluent applications. At the College Station site on 4 April 1996, the average N concentration of the ryegrass was 1.7% (0X plot), 2.9% (1X plot), and 3.8% (2X plot). This was typical at the Overton site also. In the bermudagrass, the N concentrations ranged from approximately 1.2% (0X plot) to 2.1% (2X plot).
The rate of N, P, and K applied at the College Station and Overton sites were compared to the rate of N, P, and K uptake by the vegetation (Tables 12 and 13). Only the 1X bermudagrass/ryegrass crop at Overton was able to take up as much N as was applied at the 1X application rate. On all plots, the rate of N uptake was far short of doubling with the doubling of the effluent application rate. With Coastal bermudagrass at the Overton site, as the rate of applied effluent doubled, the uptake efficiency for N and K declined about 5% while efficiency of P uptake remained similar at each rate. Uptake efficiency was considerably greater for the bermudagrass/ryegrass cropping system in which the effluent application rate was lower. At the 1X rate for this cropping system, the uptake efficiencies for N, P and K were 50.6%, 43.1% and 35.0% respectively (table 14). At the 2X rate of effluent application, uptake efficiency declined by 16% to 18%. The N which was applied but not taken up by the vegetation had other pathways for leaving the system, such as; volatilization as ammonia, runoff losses, denitrification of NO3, and leaching through the soil as NO3. The latter was reflected by an increase in NO3-N through each soil depth (tables 7 and 8).
Nutrient uptake efficiency was always greater in the double-cropping system due to lower rates of applied nutrients for each application, a longer time period of time for plants to extract nutrients from the soils, and higher yields. At the 1X effluent rate, the P applied was approximately equal to the P taken up by the vegetation. At the College Station site, the P uptake for the bermudagrass was approximately the same for the 1X and 2X rates (table 12). However, the P uptake did significantly increase between the 1X and 2X rates for the bermudagrass/ryegrass crop. On the bermudagrass/ryegrass plots at Overton, the P uptake was greater than the P applied at the 1X application rate (table 13). At the 2X rate, P uptake did not significantly increase for either crop system when the application rate doubled. Even though the excess P was not detected in the soil tests, it is likely that P would concentrate in the soil with repeated effluent applications at the 2X rate.
For the 1X effluent application, K was applied at a rate three times higher than vegetation uptake by both crop systems at the College Station site and by the bermudagrass system at the Overton site. At both the College Station and Overton sites, the K uptake for the bermudagrass crop significantly increased when the 1X and 2X rates were compared. However, when compared to the total K applied, the additional uptake was very small. There was no significant difference between the 1X and 2X rates for the bermudagrass/ryegrass crop at either College Station or Overton. On the bermudagrass/ryegrass system at Overton, 1,173 kg of K/ha/yr was applied while 736 kg/ha/yr was up-taken by the vegetation. The vegetation had higher K uptake on the plots which received a 2X effluent application with increases that ranged from 3 to 40%. Overall, the two-crop system had a higher uptake of K. The excess K not taken up by the vegetation increased the K concentrations in the first 152 mm of soil at the College Station site and at all depths at the Overton site (table 9). The rate of K applied was approximately four times that typically required by high yielding crops of ryegrass. Robinson et al. (1987) showed that K uptake in ryegrass increases from 128 to 302 kg/ha as yield was increased by increasing N application rates at high soil K levels. The K concentrations in the ryegrass which received effluent ranged from 3.1% to 5.3%. As shown in table 2, K concentrations above 3% in feed may cause negative health effects in beef cattle.
Effluent Effects on Surface Runoff
During the study period, 601 mm of rain occurred in 16 rainfall events at College Station and 595 mm of rain fell in 19 rainfall events at Overton (tables 15 and 16). The College Station site sloped 0.5% and the Overton site sloped 5.0%. The larger slope at Overton produced 213 mm of runoff while 98 mm of runoff occurred at College Station. The larger runoff volumes resulted in larger nutrient losses at the Overton site.
The higher effluent application had a slight effect on N concentrations and the total mass of N in the surface water runoff at both sites (table 17). At the College Station site, the differences between the total N losses were relatively small among treatments. At both College Station and Overton, there were large variances in the concentration data. However, the average concentrations at both the College Station and Overton sites were very similar.
On average, the total loss of N in the surface runoff at the Overton site was approximately 5 times higher than the College Station site. The N losses on the bermudagrass/ryegrass plots showed a trend of increased losses with increased application rates. However, the increased N losses were not significant. Even though N is required for eutrophication of surface water, Ptypically is the limiting nutrient as the other nutrients are generally available from the natural environment.
At the College Station site, the rate of effluent application had almost no effect on P in the runoff (table 18). The amount of P in the runoff increased with effluent application rate at the Overton site. However, only the 2X application rates produced significantly higher P losses than the 0X rates. On average, the total P losses at the Overton site were 3 times larger than the College Station losses. The average P concentrations at Overton and College Station were very similar.
The effects of effluent application were much more apparent for K than for N or P. At both sites and for both crop systems the concentrations and quantity of K in the runoff were higher in the 2X effluent plots than in the 1X, and the 1X plots were higher than the 0X plots (table 19). At the Overton site, only the 2X plots were significantly higher than the 0X plots. The quantity and concentrations of K were not significantly affected by the crop systems at the College Station site. However at the Overton site, the K concentrations in the runoff were lower for the bermudagrass/ryegrass than the bermudagrass-only crop system.
SUMMARY AND CONCLUSIONS
Soil pH was increased in the top 152 mm of the Bowie soil at Overton in the 2X plots due to the large difference between effluent pH (8.1) and initial soil pH (6.0). Soil pH in the bermudagrass/ryegrass plots at Overton increased from 5.8 to 6.8. Similarly, soil E.C. was also increased to a depth of 305 mm at Overton in the 2X plots due to low background soil values (6.5 mS/m) and high effluent values (1,458 mS/m). Soil conductivity increased approximately 10 mS/m per year to a depth of 152 – 305 mm at the 2X application rate.
Significant nutrient increases in the soil were directly related to effluent nutrient levels and background soil concentrations. The phosphorous levels in the effluent at College Station (76 mg/L) and Overton (155 mg/kg) were relatively low. The background soil concentrations at College Station were high (39 – 146 mg/kg) and the background concentrations at Overton were (0 – 34 mg/kg). No significant increases in soil P concentrations were detected at any depth at either site.
However, the high level of K in the effluent at Overton ((3217 mg/L) and low background levels in the soil (0 – 83 mg/kg) resulted in significant increases throughout the soil profile to a depth of at least 610 – 914 mm at the 2X application rate. At the College Station site, the high K background levels in the soil (246 – 785 mg/kg) and lower effluent levels (1121 mg/L) resulted in significant increases only in the 0 – 152 mm depth at the 2X application rate.
Nitrate increases in the soil followed a similar pattern. The high N concentrations in the effluent (1,480 mg/L at Overton, 581 mg/L at College Station) and low background NO3 levels (1 – 11 mg/kg at Overton, 1 – 2 mg/kg at College Station) resulted in significant nitrate concentration increases throughout the soil profiles at the 2X application rate at both sites.
At Overton, the bermudagrass/ryegrass crop had significantly higher yields than the bermudagrass-only crop at all three application rates (0X, 1X and 2X). However, the 2X application rate (1076 kg N/ha/yr) did not significantly increase yields for either crop system above the 1X application rate (538 kg N/ha/yr) at either site. This indicates that 538 kg N/ha/yr is adequate for both the bermudagrass and bermudagrass/ryegrass crops.
The bermudagrass/ryegrass crop removed a greater percentage of the N, P, and K applied in the effluent than did bermudagrass alone. The best performance was achieved by the bermudagrass/ryegrass crop at the 1X application rate where 51% of the N, 43% of the P and 35% of the K applied was taken up by the vegetation. The N concentrations in the bermudagrass ranged from 1.2% (0X rate) to 2.1% (2X rate) and the ryegrass ranged from 1.7% (0X rate) to 3.8% (2X rate).
Nutrient losses in surface runoff were directly related to the surface slope. Typically, the nutrient concentrations for N, P and K in the surface runoff were very similar at College Station (0.5% slope) and Overton (5.0% slope). However, due to the larger volume of surface runoff at Overton, the total mass of nutrient lost at Overton was up to five times higher. In addition, nutrient concentrations in the surface runoff on replicated plots exhibited a high degree of variability that resulted in average concentrations with large standard deviations. On the flat slope at College Station, application rate or crop system did not have an effect on nutrient losses. At Overton, only K losses at the 2X rate were significantly higher than the 1X rate.
ACKNOWLEDGMENT
Partial funding for this research was provided by the Southeast Poultry and Egg Association. Special thanks to Mr. James V. Davis and Mr. Allen T. Leonard at the Texas A&M University Agricultural Research and Extension Center in Overton, Texas, for their assistance with field data collection and laboratory analyses.
REFERENCES
Boyd, C. E. 1996. Water quality in ponds for aquaculture. Department of Fisheries and Allied Aquaculture. Auburn University. Auburn, Alabama.
Brown, K. W. 1995. Agronomy 616 – Land Disposal of Waste, vol. 1, spring 1995. College Station, TX: Texas A&M University.
Chaubey, I., D. R. Edwards, T. C. Daniel, P. A. Moore, Jr., and D. J. Nichols. 1995. Effectiveness of vegetative filter strips in controlling losses of surface-applied poultry litter constituents. Transactions of the ASAE. 38(6):1687-1692.
Davis, M. L. and D. A. Cornwell. 1991. Introduction to Environmental Engineering, 2nd Ed. New York, NY: McGraw-Hill, Inc.
Eastin, E. F. 1976. Use of ammonia electrode for total nitrogen determination in plants. Communications in Soil Science and Plant Analysis 7(5):477-481.
Edwards, D. R. and T. C. Daniel. 1993. Effects of poultry litter application rate and rainfall intensity on quality of runoff from fescuegrass plots. Journal of Environmental Quality 22:361-365.
Emerick, R. J. 1988. Nitrate and urea toxicities. The Ruminant Animal, Digestive Physiology and Nutrition, D. C. Church ed., Prentice Hall, A Div. Of Simon & Schuster, Englewood Cliffs, N.J., pp 480-485.
Field, J. A., R. B. Reneau, Jr., W. Kroontje, and J.S. Caldwell. 1986. Utilization of anaerobically digested poultry manure effluent nitrogen as fertilizer. Transactions of the ASAE 29(1):223-228.
Haby, V. A. 1989. Soil NO3-N analysis in Ca(OH)2 extracts by the chromotropic acid method. Soil Science Society of America Journal 53(1):308-310.
Hons, F. M., L. A. Larson-Vollmer, and M. A. Locke. 1990. NH4OAc-EDTA extractable phosphorus as a soil test procedure. Soil Science 149(5):249-256.
Jackson, M. L. 1958. Soil Chemical Analysis. Englewood Cliffs, NJ: Prentice-Hall.
Linsley, R. K., J. B. Franzini, D. L. Freyberg, and G. Tchobanoglous. 1992. Water-Resources Engineering, 4th Ed. New York, NY: McGraw-Hill, Inc.
McFarland, M. L., E. S. Chasteen, G. Lindemann, R. G. Lemon, F. Mazac, Jr., and B. L. Harris. 1995. Vegetative filter strips for control of nonpoint source nutrient losses. In Proceedings Innovations and New Horizons in Livestock and Poultry Manure Management, 2:16-27. Austin, TX: Texas Agricultural Extension Service, 6-7 September.
National Science Foundation. 1996. Nutrient Requirements of Beef Cattle, 7th Ed. Washington, DC: National Academy Press.
Nelson, D. W. and L. E. Sommers. 1980. Total nitrogen analysis for soil and plant tissue. Journal Assoc. Off. Anal. Chem. 63:770-778.
Raabe, S. L., J. M. Sweeten, B. R. Stewart, D. L. Reddell. 1984. Evaluation of manure flush systems at
caged layer operations. Transactions of ASAE. 27(3): 852-858.
Recommendations for sampling and analysis of soils and manure for land application of feedlot manure. 1992. An ad-hoc group of soil scientists and agricultural engineers, Texas Agricultural Extension Service, Texas Agricultural Experiment Station, Texas A&M University, Agricultural Research Service, U.S. Department of Agriculture, and the Texas State Soil and Water Conservation Board. College Station, TX: Texas Agricultural Extension Service, 9 March.
Robinson, D. L. and T. L. Eilers. 1996. Phosphorus and potassium influences on annual ryegrass production. Louisiana Agric. 39(2):10-11.
Robinson, D. L., K.G. Wheat and N. L. Hubbert. 1987. Nitrogen fertilization influences on Gulf ryegrass yields, quality and nitrogen recovery from Olivier silt loam soil. Louisiana Agric. Exp. Stn. Bull. No. 784.
Sawyer, C. N., P. L. McCarty, and G. F. Parkin. 1994. Chemistry for Environmental Engineering, 4th Ed. New York: McGraw-Hill.
Sweeten, J. M. 1995. Unpublished data, Texas Agricultural Experiment Station, Amarillo, TX.
Sweeten, J. M. 1986. Caged layer manure management. Bulletin L-2194. College Station: Texas Agricultural Extension Service.
Texas Natural Resources Conservation Commission, 1995. Control of Certain Activities by Rule. Subchapter K. Concentrated Animal Feeding Operations. 30 TAC Sections 321.181 – 321.198. Texas Register 20 (50) : 4727-4742.
Wilkinson, S. R. and J. A. Stuedemann. 1990. Fate of copper in broiler litter applied to Coastal bermudagrass and tall fescue. In Agronomy Abstracts 1990 Annual Meetings, San Antonio, TX, 21-26 October.
Tables

Table 1. Range of plant nutrient concentrations in six poultry lagoons in Texas in the summer of 1994.
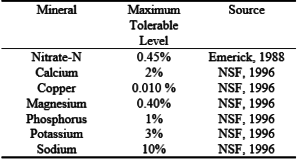
Table 2. Maximum tolerable nutrient levels in vegetation for beef cattle.

Table 3. Vegetation harvest dates at College Station and Overton.

Table 4. Soil sampling dates at College Station and Overton.

Table 5. Effluent application dates at College Station and Overton.
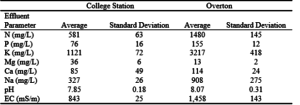
Table 6. Average lagoon effluent properties, with standard deviations, of the seven effluent applications applied to the College Station and Overton research plots.
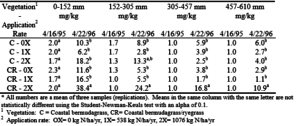
Table 7. Soil nitrate (NO3-N) at the College Station site as a function of soil depth and sampling date.

Table 8. Soil nitrate (NO3-N) at the Overton site as a function of soil depth and sampling date.

Table 9. Soil potassium at the Overton site as a function of soil depth and sampling date.
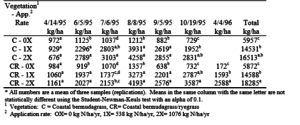
Table 10. Vegetation yield for seven harvests and the yearly total at the College Station site.
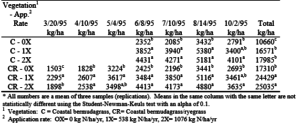
Table 11. Vegetation yield for seven harvests and the yearly total at the Overton site.

Table 12. Nutrient application rates and vegetation uptake rates at the College Station research site.

Table 13. Nutrient application rates and vegetation uptake rates at the Overton research site.
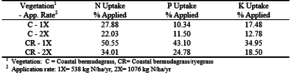
Table 14. Uptake efficiencies for nitrogen, phosphorus, and potassium at the Overton site based on amount of nutrients applied.

Table 15. Rainfall and surface runoff data at the College Station site.
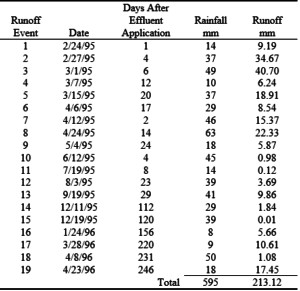
Table 16. Rainfall and surface runoff data at the Overton site.
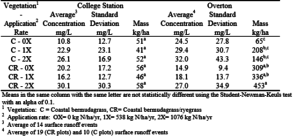
Table 17. Average nitrogen concentrations with standard deviations and total nitrogen in the surface runoff at the College Station and Overton sites.
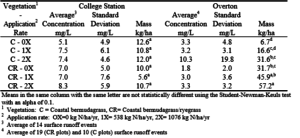
Table 18. Average phosphorus concentrations with standard deviations and total phosphorus in the surface runoff at the College Station and Overton sites.

Table 19. Average potassium concentrations with standard deviations and total potassium in the surface runoff at the College Station and Overton sites.
Original article by L. J. Aldrich, C. L. Munster, V. A. Haby, J. M. Sweeten
effluentView original article (PDF)
